


Network Monitoring Dashboard updated: A Better Overview of Chain Health
👋 Dear Powerians,
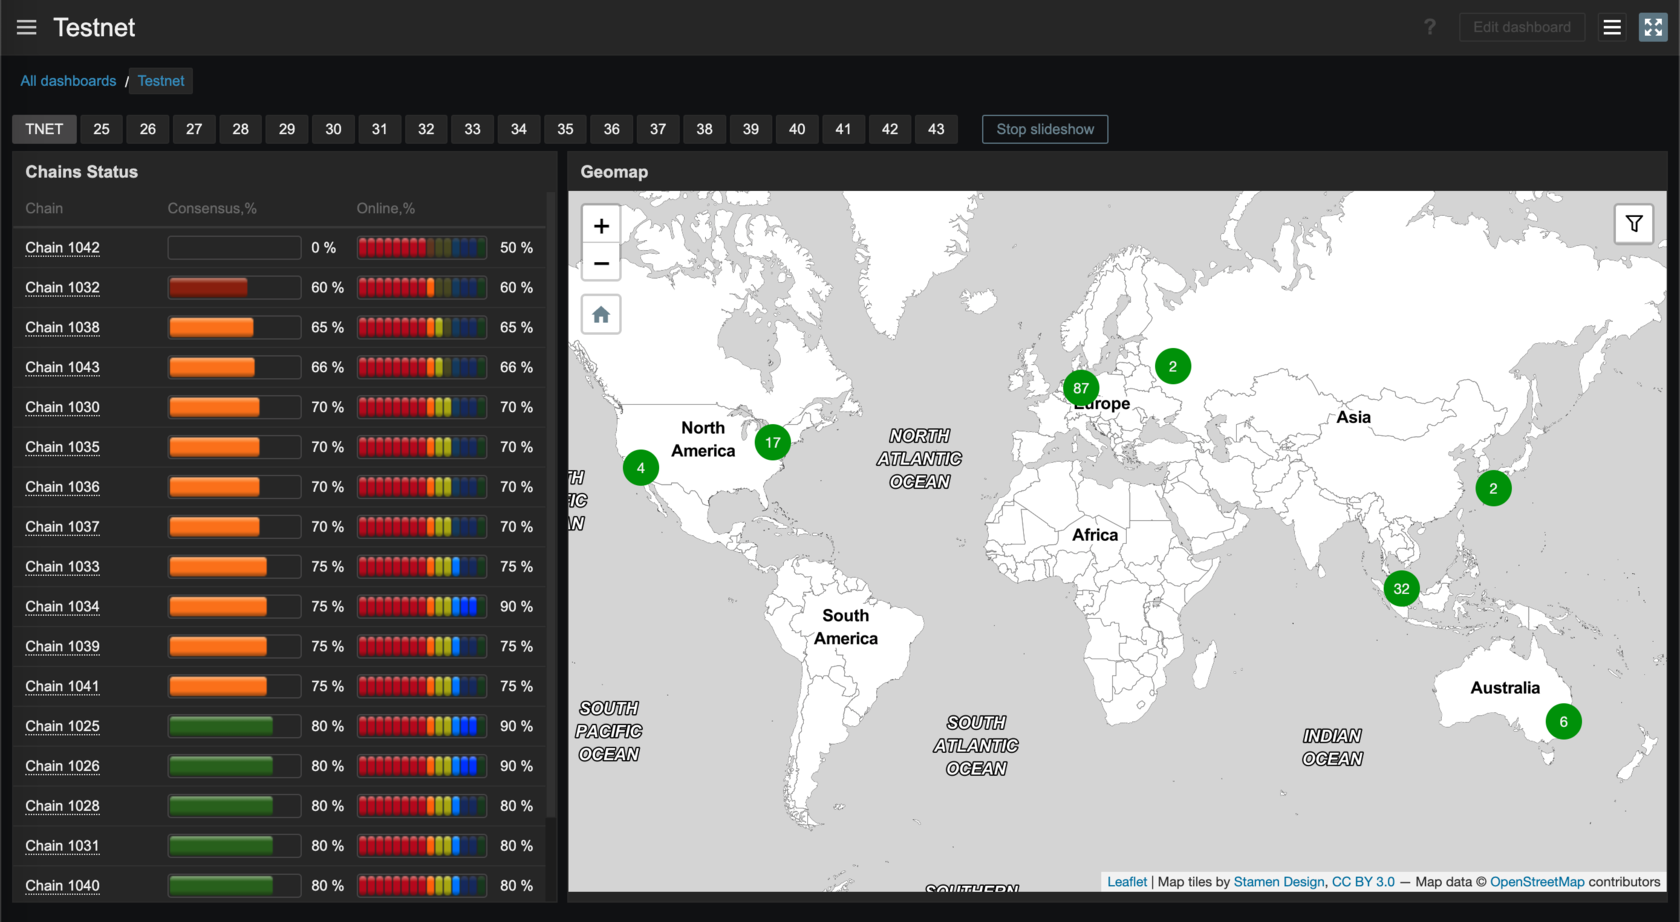
⚙️ We have updated the network monitoring dashboard. With this update, you can now get a clear view of the overall status of the chains on the network.
📌 For instance, when there are too few nodes, the nodes stop ticking, and node owners cannot understand why. With this update, this problem will be clearly visible. For example, in the screenshot of chain 1042, only half of the nodes are online. This is not enough for consensus, so the entire chain is considered offline. Another example is chain 1034, where it is clear that there are more online nodes than those participating in consensus. This indicates a problem with some of the nodes. If you click on tab 34, you will see two nodes with a height of 0.
🎈 We have also added notifications to the Telegram bot. Points are awarded for the work of nodes. With these notifications, noders can timely notice the problem and react.
🎉 We hope this update will make monitoring the network easier and more convenient for our community members. As always, we appreciate your continued support and interest in our project.


